The Oil Intensity Index: Tracking Real Improvements in India’s Resilience

MUMBAI — Assessing India’s energy vulnerability through the Net Oil Import Bill as % of GDP is a common but flawed exercise. This metric is a hostage to Brent volatility and currency swings, often obscuring structural progress with market noise. Especially amidst heightened geopolitical risk—most recently the price fluctuations following the Iran-Israel conflict—investors require a more refined tool to isolate physical reality from the ticker.
The Value Trap
Standard value-based ratios frequently yield false signals. For instance, the FY24 drop in the net bill to ~2.8% of GDP was largely a "Russian discount" dividend rather than a structural shift. Conversely, a price spike can make the economy appear structurally less efficient overnight, despite no change in per-unit consumption.
To accurately track resilience, we introduce the Composite Intensity Index, which strips away pricing anomalies by indexing physical volume against real output:
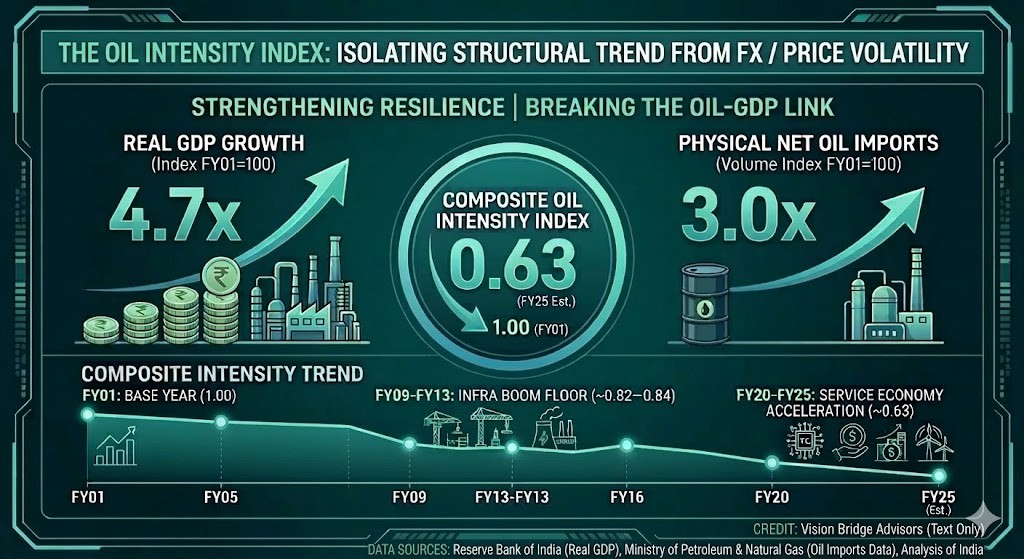
Composite Index = Net Oil Import Volume Index (FY01=100) / Real GDP Index (FY01=100)
The Decoupling Trend (FY01–FY25)
Using this tool to index physical volumes against real output reveals a massive, multi-decade "thinning" of the economy:
Growth Divergence: Since FY01, Real GDP has expanded 4.7x, while net oil import volumes have only tripled ($Index=294$).
Compression: The Index has dropped from 1.00 in FY01 to 0.63 in FY25E—a 37% improvement in the oil-productivity of the economy.
Resistance Levels: The index stalled at ~0.82 during the 2009–2013 heavy capex boom, signaling that only massive infrastructure cycles act as a floor to this decoupling.
Takeaway
While headline import bills dictate near-term CAD and currency swings, this Composite Intensity Index is the superior gauge for modeling long-term sovereign risk. It confirms that India is structurally reducing its "oil beta," providing a critical buffer against the geopolitical risk premia now permanent in global energy markets.